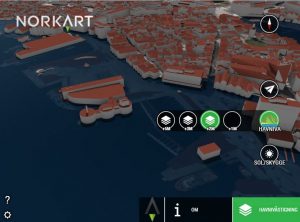
Stavanger, Norway’s third largest city, is situated directly on the Atlantic coast. Rising sea levels will affect the entire Stavanger region, therefore a 3D visualisation was created to demonstrate how the area will be affected based on different climate change scenarios.

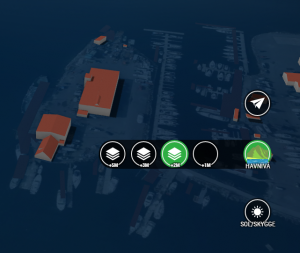
Rising sea level visualisations are easily created in OpenCities Planner. This project allows the user to toggle between different scenarios and explore the impact in a 3D model covering the entire region.
To set up such a project, you can begin by uploading a 3D-model representing the sea level ‘surface’. To add options, make copies of the 3D-water surface and set each to a different altitude. Finally, place these copies in different layers with labels indicating the sea level. The Layer Buttons can then be used by the visitor to toggle between different visualisations.
